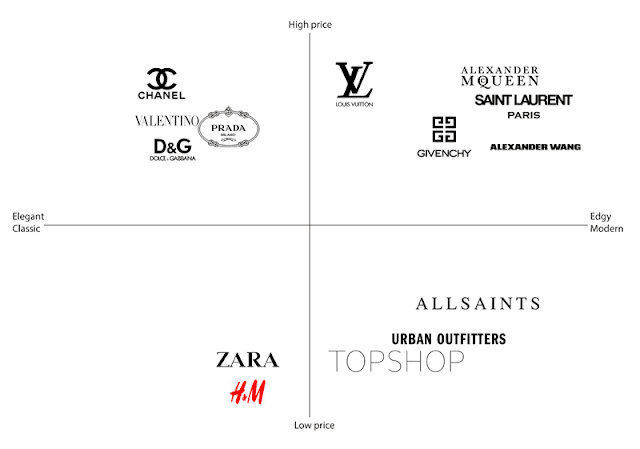
This brand positioning map shows us that D&G is, non surpassingly, in the high price range, but we also see it is in the classic branch and not modern where we can find some of D&G's competitors such as YSL or LV. This brand positioning map is very accurate. Dolce Gabbana is in a high price range and does have a more classic look or at least not as much following the trend. We can see most selling brands are on the edgy/modern side of the map and shows they are more in connection with the trends of today and are providing for what their audience is asking. D&G needs to modernize their clothing or keep a simple outlook but focus on their image and reputation, as well as potentially revisiting their way of advertising. Either way their still is a need of change in the designs, a refreshed look for a brand in need of new look.
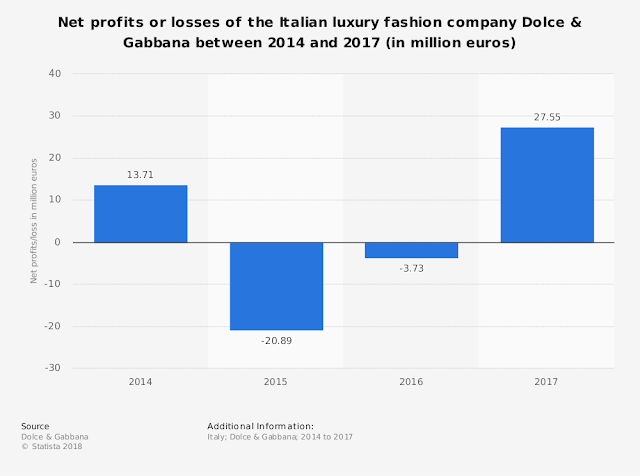
Statista. (2019). Net profits/loss of Italian company Dolce & Gabbana in 2014-2017 | Statistic . [online] Available at: https://www.statista.com/statistics/675310/net-profits-loss-of-italian-company-dolce-and-gabbana/ [Accessed 28 Jan. 2019]. We can see on the graph that D&G started off good in 2014 with about € 13 Millions and than dramatically went down to about € - 20 Millions in 2015 meaning the net profits wasn't has good at this time. It eventually came back up to about € 27 Millions in 2017. This show the brand has had ups and downs before and they may be facing a down phase now.
Comments
Post a Comment